
The Effects of Renewable Energy Consumption on Life Expectancy and GDP
Using renewable energy and petroleum consumption data from 35 European countries from 2010-2019, this paper finds that increasing renewable energy consumption increases life expectancy; at the same time growth in renewable energy consumption negatively impacts GDP per capita growth.


Abstract
Existing literature suggests that particulate exposure from fossil fuel plants is negatively correlated with life expectancy and housing asset value. However, there is an opportunity for further research into the public health and economic implications of clean energy consumption. Using renewable energy and petroleum consumption data from 35 European countries from 2010-2019, this paper finds that increasing renewable energy consumption increases life expectancy; at the same time growth in renewable energy consumption negatively impacts GDP per capita growth, but the magnitude of this impact is very low. Three fixed effects models were estimated to obtain these results. While the first two models capture linear changes in both the independent and dependent variables, the third model observes changes in consumption and GDP per capita growth using percentages. Additionally, country-specific characteristics include population, unemployment rate, secondary education completion percentage, life expectancy, and petroleum consumption. Consequently, this paper discusses the implications of both results and identifies areas for continued research.
Introduction
The effects of climate change and extreme weather are becoming increasingly widespread. Countries have made agreements on mitigation and adaptation strategies, the largest of which was the Paris Agreement, signed in 2015 by 196 countries(UNFCCC 2015). Existing literature surrounding the negative externalities of fossil fuel usage indicates that exposure to particulate matter decreases life expectancy. These findings emphasize the importance of agreements like the Paris Agreement and commitment to globalizing sustainable energy usage. Throughout this paper, the words “renewable energy” and “sustainable energy” may be used interchangeably. However, they refer to energy obtained from sources that are not depletable such as wind, solar, or hydroelectric sources. Similarly, the term “fossil fuels” is also used frequently and refers to sources like petroleum or other natural gasses that are used as sources of energy.
Additionally, climate change is a persistent global issue, and examining ways to solve this issue is tremendously important. Unfortunately, as renewable energy implementation grows, the literature surrounding the public health and economic implications does not expand in kind, meaning existing scholarship about renewable energy implementation is not as robust. To fill part of this gap in the existing literature, this paper observes the effects of renewable energy consumption on public health indicators, such as life expectancy. In addition, this paper investigates the economic implications of renewable energy consumption as it relates to changes in GDP per capita. Understanding how these factors affect the well-being of citizens in each country can better inform countries about their transition strategy.
Literature Review
Previous literature suggests that fossil fuel emissions have adverse effects on financial assets, such as housing property value, life expectancy, and infant health. In a 2015 research paper titled "Environmental Health Risks and Housing Values: Evidence from 1,600 Toxic Plant Openings and Closings,” Janet Currie, Lucas Davis, Michael Greenstone, and Reed Walker observe the effects of power plant openings and closures on property value and infant health. Their study uses housing data from five states within the contiguous United States and infant birth weight data controlling for smoking, age, gender, and race. Additionally, the authors note that different types of pollutants travel differently in the air due to size and density. They notice that houses experience different levels and types of pollutants depending on proximity to the power plant.
The discussion of the results is split into two sections: the first one discusses housing property value while the second discusses infant birth weight. In the first section, the authors run eight different regressions, two regressions for each proximity increment, on three different panels. Panel A estimates the effects of plant operation on housing value, Panel B uses a first differences approach to estimate the same outcome as Panel A, and Panel C uses a first differences approach to estimate the effects of plant opening and closing on housing value (Currie, Davis, Greenstone, et al. 2015). In each model, housing value is negatively affected by the operation, openings, and closures of power plants. They conclude that in the year after a power plant’s opening, housing values decrease but rebound after a year. The authors also note that the adverse effects are negligible for houses located more than a mile away from a power plant. Finally, the authors conclude that there could be an issue of imperfect information. Housing values likely have not factored in harmful pollutant exposure resulting in an overestimated valuation. They conclude that if the valuation was calculated more accurately, the results would likely differ from the outcome they observed (Currie, Davis, Greenstone, et al. 2015).
In the infant birth weight section, the results are not as straightforward. The authors again run eight different regressions but for only two panels: Panel A for the estimated effect of plant operation on infant birth weight and Panel B estimates the effect of plant openings and closures on birth weight. They find that more cases of low infant birth weight occur in the years after a power plant opens while in the years after its closure, instances of low-birth-weight decline (Currie, Davis, Greenstone, and Walker 2015). Additionally, proximity and length of exposure make a statistically significant difference in instances of low infant birth weight. However, the instances of low infant birth weight decline by a fraction of a percent after plant opening and during operations which causes the authors to be less conclusive overall (Currie, Davis, Greenstone, and Walker 2015). In conclusion, the adverse effect of power plant openings, closures, and operations on housing value and infant birth weight cannot be overlooked.
In another 2015 paper titled “Growth, Pollution, and Life Expectancy: China from 1991-2012”, Ebenstein, Fan, Greenstone, et al. do a cross-sectional analysis of how particulate matter and income affect life expectancy in China while factoring in all-cause mortality. Additionally, the effect of GDP per capita on life expectancy was also observed. In the paper, life expectancy was measured both in life expectancy from birth and life expectancy from age five. The authors write that this distinction was made to observe differences between mortality due to cardiovascular health issues, perpetuated by particulate matter, versus non-cardiovascular issues, which affect younger children.
Aside from using cross-sectional data analysis from the years 1991-2000 in Panel A and from 2004-2012 in Panel B, the authors use a first differences approach in Panel C. In Panel A, a doubling in GDP per capita is expected to increase life expectancy by 3.5 years while decreasing non-cardiovascular mortality (Ebenstein, Fan, Greenstone, et al. 2015). Additionally, Total Suspended Particulate (TSP) exposure negatively affects cardiovascular mortality, which aligns with the authors’ expected findings. Panel B told a similar story. A doubling in GDP per capita increases life expectancy by 2.2 years (Ebenstein, Fan, Greenstone, et al. 2015). The decrease from Panel A could be indicative of better healthcare practices that have been implemented in China since 2000. Similarly, though exposure to Particulate Matter (PM) has increased both non-cardiovascular and cardiovascular mortality, the estimated negative effects on life expectancy were not statistically significant at the ten percent level. In Panel C, the First Differences approach reveals that PM exposure has a statistically significant adverse effect on life expectancy at age 5 (Ebenstein, Fan, Greenstone, et al. 2015). The findings reveal that health benefits due to China’s precautionary steps to mitigate the effects of particulate exposure have helped younger children the most rather than adults who are affected by exposure in the long term.
Both studies are very useful in that they explore how fossil fuel emissions adversely affect population well-being which is measured from both a public health and financial standpoint. Additionally, both models employ a first differences approach which helped yield more conclusive results. However, the main drawback to both studies is that they are heavily localized either on the state or national level. This provides an opportunity to observe how clean energy consumption affects financial well-being and public health on a more widespread level.
Theory
For the first model in the research question, economic theory suggests that an increased consumption of fossil fuels, such as petroleum, adversely affects life expectancy. This is corroborated by both studies mentioned above and is especially stated by Ebenstein, Fan, Greenstone, He, Yin, and Zhou in their 2015 paper. As mentioned above, they conclude that particulate matter particles, a byproduct of fossil fuel consumption, affect the life expectancy of young children and adults who are exposed for longer periods. What is less clear is how renewable energy consumption affects life expectancy. Intuitively, relying more on renewable energy to supply power to a country’s national grid would reduce the reliance on fossil fuels, decreasing human exposure to particulate matter and potentially increasing life expectancy. However, fossil fuels and renewables are not perfect substitutes for a source of energy (Kumar, Fujii, and Managi 2015). For example, while both fossil fuels and renewables can be used to power homes and industrial buildings, consumers who own gas-powered vehicles are unable to tap into sustainable energy sources. For this reason, fossil fuels are still important in the world economy. Additionally, reducing the reliance on fossil fuels does not reduce the acute effects of PM and TSP byproducts on surrounding communities. As mentioned in the 2015 paper "Environmental Health Risks and Housing Values: Evidence from 1,600 Toxic Plant Openings and Closings,” proximity to power plants does affect infant health. Similarly, this exposure is likely problematic for adults who sustain long-term exposure. When considering the effect reducing fossil fuel consumption and increasing renewable energy consumption has on life expectancy, it is more intuitive than accounting for the acute effects. It’s unlikely that fossil fuels will disappear entirely, and as a result, neither will the acute adverse effects. Observing the overall trend may tell one story, but this doesn’t mean that the same communities who are victims of acute effects are no longer at risk.
The second model in the research question estimates the effect of renewable energy consumption on Gross Domestic Product (GDP) per capita. The economic theory surrounding this notion is not as widely discussed. As mentioned earlier on, Ebenstein, Fan, et al. discuss how the prevalence of PM and TSP pollutants negatively affects housing asset valuation in their 2015 paper. However, this study does not provide information on the implications of how GDP per capita is affected by fossil fuel consumption. From an intuitive perspective, GDP per capita growth depends on a country’s economic structure. Countries that profit from fossil fuel exportation would have a GDP per capita value that reflects this. Additionally, fossil fuels are an input necessary to the manufacturing process, so profits from goods manufactured using fossil fuels would positively impact GDP per capita. Hence, both consumption and exportation of fossil fuels contribute to GDP per capita barring any supply and demand shocks that may occur. Then, would reducing the consumption of fossil fuels negatively decrease GDP per capita? Answering this question is not straightforward since it depends heavily on the country’s reliance on renewable energy. Additionally, the renewable and fossil fuel industries have different associated manufacturing costs and market structures. For example, in the manufacturing process, renewables are a viable substitute for fossil fuels, but the degree of substitutability depends largely on the cost of both inputs. Additionally, the fossil fuel market has different barriers to entry for firms and hiring frictions for employees than the renewable energy market. The skills required to operate wind turbines, solar panel fields, and hydroelectric dams are different from drilling for oil and refining it (Lim, Aklin, and Frank 2023). Increasing reliance on renewables may stimulate economic growth by creating more jobs, thereby increasing GDP per capita. This does not mean that fossil fuels will cease positively impacting GDP per capita, but the fossil fuel industry may experience less growth as a result, hence contributing less to GDP per capita over time. Therefore, looking at the growth of fossil fuel and renewable energy consumption and its impact on GDP per capita could provide useful information.
In conclusion, the economic theory surrounding both models stated in the research question is very nuanced. The first model estimating the effects of renewable energy consumption on life expectancy does not consider the fact that pollution from fossil fuels is certainly not evenly distributed amongst a population. For that reason, a country that starts to rely more on renewable energy sources and less on fossil fuels will not observe uniform effects on its population. In the second model, due to varying market regulations and economic structures across countries, the consumption of renewable energy may impact GDP per capita differently. Since GDP per capita is impacted by fossil fuel consumption as well, this further complicates the reciprocal substitution between fossil fuels and renewable energy sources. Using a fixed effects model can help control for factors like these that vary by country but it may not capture the nuances of each model from the economic theory perspective.
Data and Methodology
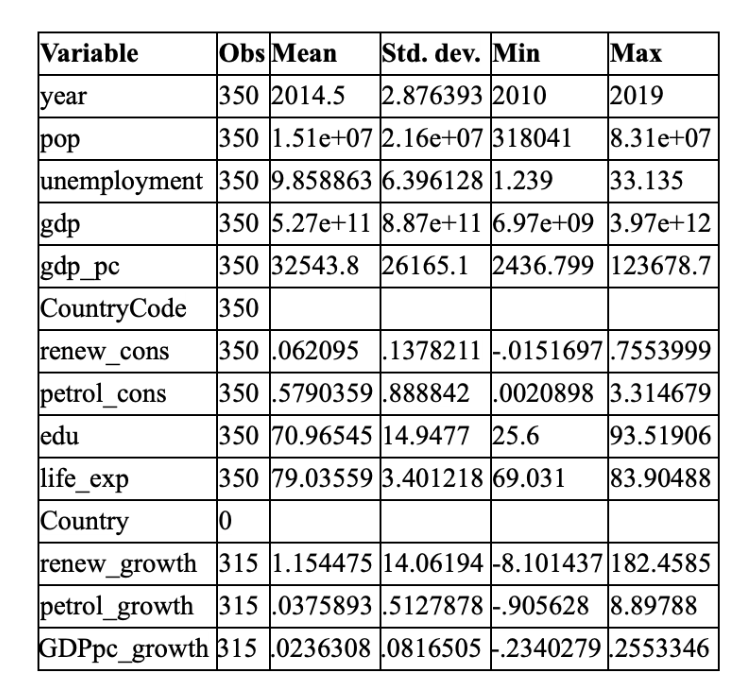
Data surrounding renewable energy and fossil fuel consumption was obtained from the EIA online database while the data measuring population well-being such as life expectancy and world economic data, namely GDP, unemployment, secondary education completion, and population, came from the World Bank. Both the EIA and World Bank are very large databases that contain a vast amount of country-specific data. From there, additional variables such as GDP per capita, GDP per capita growth, renewable energy consumption growth, and fossil fuel consumption growth were created to be used in the growth model. At first, the panel contained around 8,000 observations from each country from the years 1980 to 2022. This was problematic since depending on the country and its development level, data on secondary school completion percentages and unemployment were missing for either all years or present in only a handful. The lack of data for these countries is likely caused by countries not having the resources to report on information like unemployment or secondary education completion. This gap unfortunately caused the panel to be unbalanced and unusable. Subsequently, the panel was cut down to countries that had observations for all variables from the year 2010 to 2019. In this way, the panel was now balanced but another issue surfaced: the countries present in the panel were located arbitrarily. Essentially, South American, Asian, and European countries were included in the panel which is good considering it increases the number of observations, but problematic since it would introduce exogeneity into the models. Including countries from a similar region in the world would mean that any exogenous circumstances that could affect life expectancy, such as a climate catastrophe, or GDP per capita, such as war or a recession, would likely affect the surrounding countries. Lastly, countries not in the European Union were eliminated from the panel which resulted in a total of 350 observations from 35 countries over the years 2010 to 2019 (Figure 1).
As mentioned earlier, estimating the effects of renewable energy consumption on population well-being requires three different model approaches. The first model, using a fixed effects approach, estimates the effect of renewable energy consumption on life expectancy while controlling for population, GDP per capita, secondary education completion, unemployment, fossil fuel consumption, and year (Figure 2). Using a fixed effects approach allows the model to account for systematic differences that vary with time across observations that are not controlled for by the model parameters. Some of these ‘variations’ may include policy changes, natural disasters, or other time-variant factors. The second model estimates the effect of renewable energy consumption on GDP per capita while controlling for petroleum consumption, unemployment percentage, life expectancy, secondary education completion, and year (Figure 2). Similar to Model 1, Model 2 uses a fixed effects approach as well. Lastly, Model 3 is an iteration of the second model that uses percentage values of GDP per capita, renewable energy consumption, and petroleum consumption (Figure 2). In this way, Model 3 looks at growth trends which offers a nicer interpretation value than the original units of measure used for renewable energy and petroleum consumption. The energy consumption variables were measured in quadrillion British Thermal Units (BTU) which results in small decimal values being recorded for each country over time while GDP per capita is measured in U.S dollars. Unemployment is given as a percentage of the total population facing unemployment and secondary education is measured as a percentage of the total population who have completed secondary schooling.
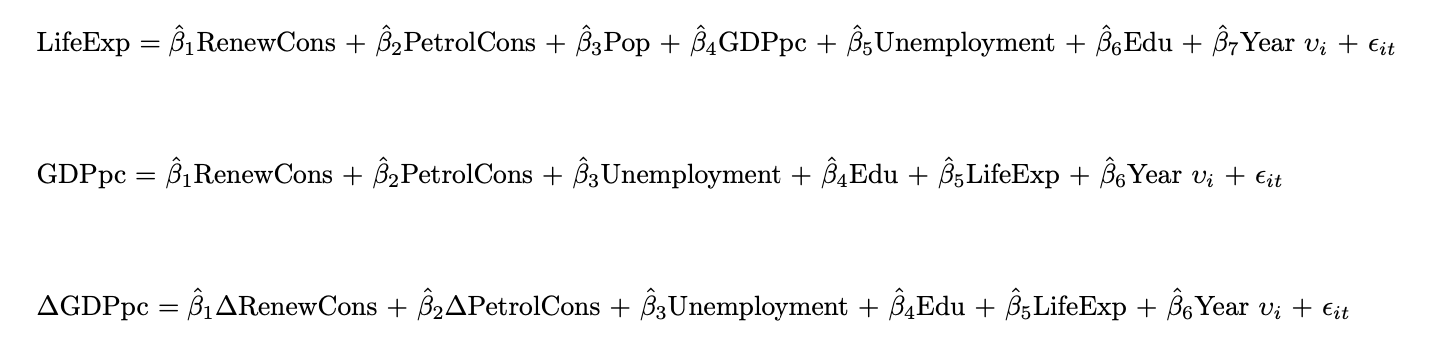
Notes: (From top to bottom) Model 1 estimates the effect of renewable energy consumption (RenewCons) on life expectancy (LifeExp) while controlling for population (Pop), GDP per capita (GDPpc), unemployment percentage (Unemployment), secondary education completion percentage (Edu), and year (Year). Using the same variables, Model 2 estimates the effect of renewable energy consumption on GDP per capita controlling for petroleum consumption, unemployment percentage, secondary education completion percentage, life expectancy, and year. Model 3 is an iteration of the second model that uses percentage values for GDP per capita, renewable energy consumption, and petroleum consumption using the same control variables.
The methodology behind the creation of these three models stems from the notion that population well-being can be measured in several ways. In the context of the research question, it examines well-being through the lens of public health and economic well-being. In Model 1, the dependent variable is life expectancy, and it is based heavily on the model used in Ebenstein, Fan, Greenstone, He, Yin, and Zhou’s 2015 paper. However, rather than just looking at the effects of PM (Particulate Matter) and TSPs (Total Suspended Particles) on all-cause mortality and life expectancy after age 5 in China, Model 1 looks at life expectancy changes across countries in Europe. Additionally, petroleum consumption is used rather than PM and TSP levels. This choice was based on the research question being focused on sustainable energy transition, so measuring petroleum consumption provides more relevant information in this context. Model 2 takes GDP per capita as the dependent variable which is loosely based on Currie, Davis, Greenstone, and Walker’s 2015 paper. Although this paper does not use housing asset value, GDP per capita is a good indicator of economic output and macroeconomic theory suggests that more economic output can increase the population’s financial well-being on average. Finally, Model 3 is a fixed effects model that uses percentage values for GDP per capita, renewable energy consumption, and petroleum consumption. This choice was motivated by the fact that measuring consumption in quadrillion BTUs is harder to interpret. Instead, looking at consumption growth can provide information on how consumption choices by a country have an impact on economic output. Additionally, increased or decreased consumption growth could reflect market growth patterns and potential externalities to investment in either the renewables or petroleum sectors.
Results
Starting with Model 1, the regression was run a total of three times, adding renewable energy consumption and petroleum consumption to the second and third iterations while the fourth iteration uses the complete model with robust standard errors (Figure 3).
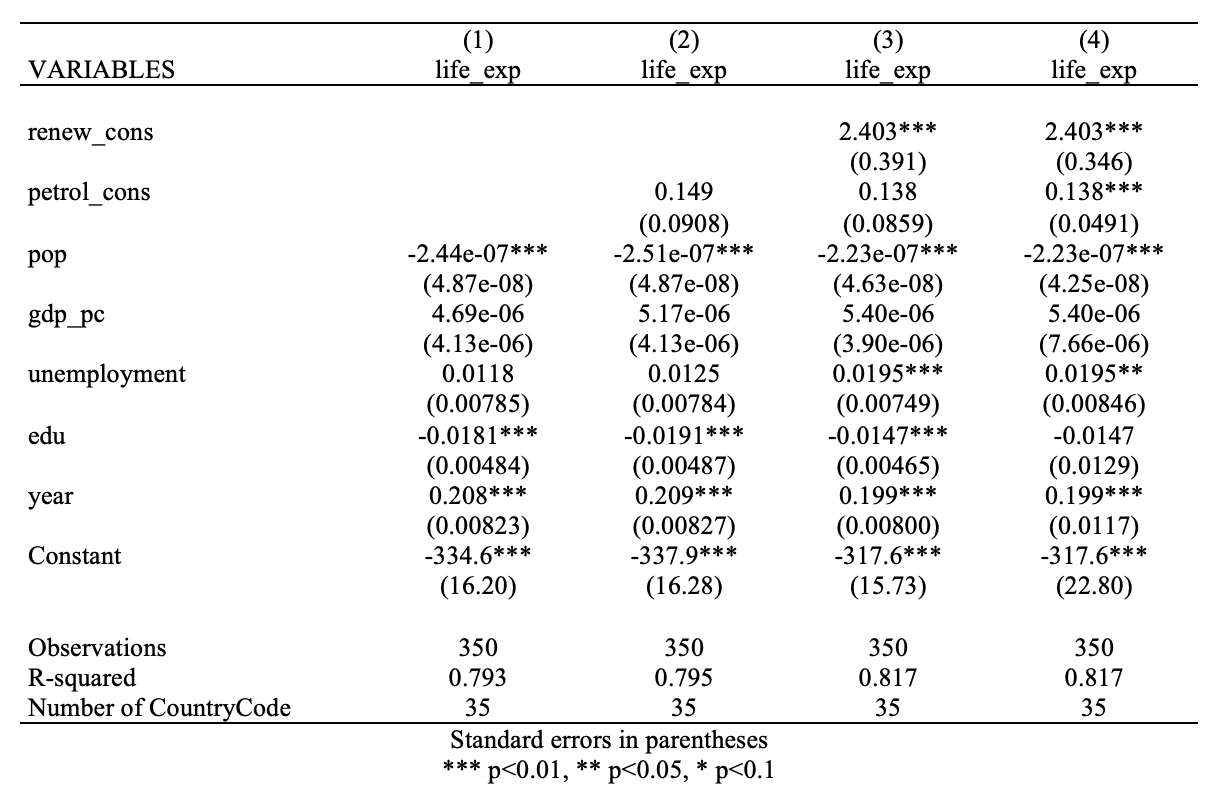
Taking the results at face value reveals some interesting results. Firstly, looking at the ‘pop’ row, as population increases, this negatively affects life expectancy, implying that as population increases, resource distribution increases across a population which could result in lower life expectancies. Additionally, looking at the table, it shows that secondary education completion adversely affects life expectancy. This result is interesting considering that higher educated people often have access to better jobs which come with more benefits, but it’s also possible that just because an individual has a higher education level does not mean they’re less susceptible to contributors of all-cause mortality. Next, petroleum consumption is statistically significant in the fourth iteration of Model 1 yet not in the third iteration. However, in both, renewable energy consumption has a positive correlation with life expectancy. One reason for this is to take into consideration the magnitude of the coefficient for renew_cons. The results imply that increasing renewable energy consumption by 1 quadrillion BTUs increases life expectancy by 2.403 years. Considering that most of the European countries in the panel have an average fractional renewable energy consumption of .06 BTUs, overhauling energy consumption by a factor of 20 would almost certainly have vast public health implications. Depending on country size, 1 quadrillion BTUs could account for a very large percentage of total energy consumption which helps explain the magnitude of the renew_cons coefficient. However, this does not explain the change in significance for the petrol_cons coefficient. Using robust standard errors allows for the regression to adjust for systematic issues or variance across observations not initially accounted for. It is possible that factors such as policy decisions or economic regulations not initially accounted for in the model have effects on petroleum consumption which thereby affect life expectancy albeit by a small amount.
Next, Model 2 was run similarly to Model 1 with four total iterations. Iterations two and three add petroleum and renewable energy consumption while the fourth iteration uses robust standard errors for the model including all controls (Figure 4).
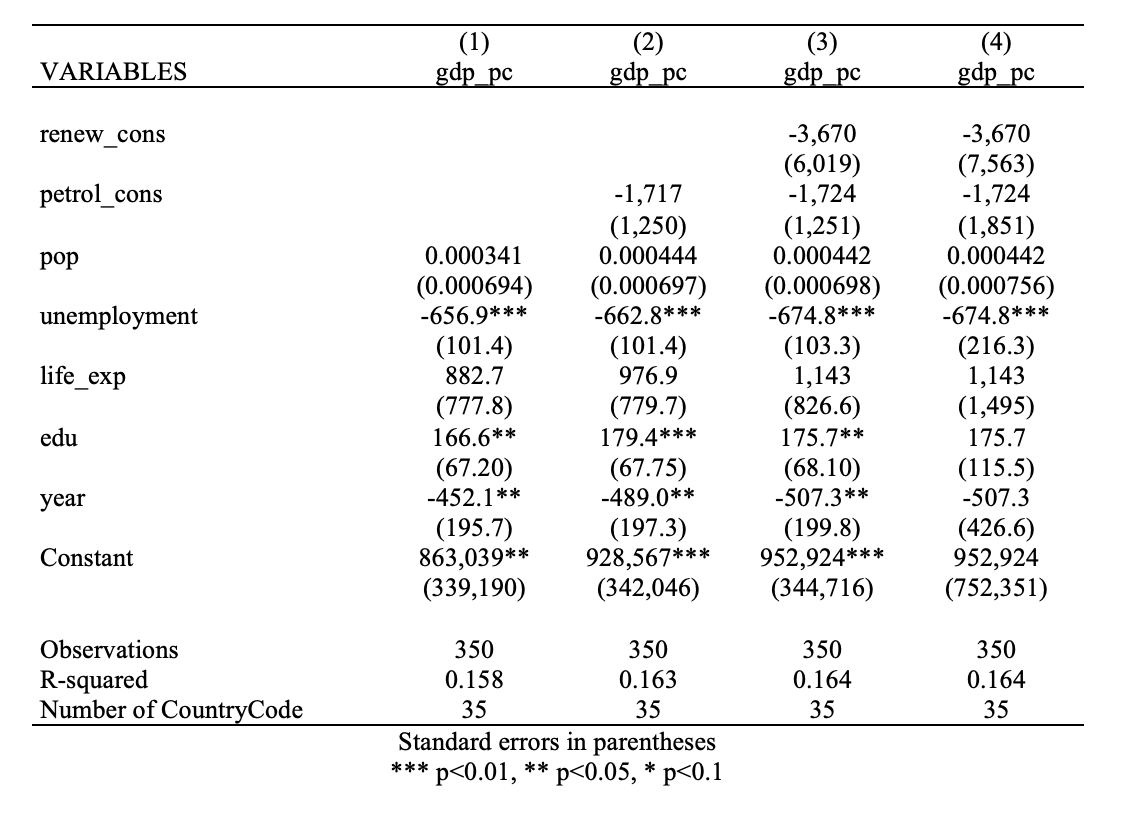
Though Model 2 uses the same data analysis techniques as Model 1, the results and significance values are quite different. Firstly, unemployment has a statistically significant negative effect on GDP per capita which aligns with the existing economic theory, and this negative correlation increases in magnitude across each iteration. This too follows for education up until the fourth iteration of Model 2. As mentioned earlier, just like secondary education completion may not absolve individuals from factors of all-cause mortality, the same could be true in this instance. Completing secondary education may not increase GDP per capita in a meaningful way when taking into consideration unaccounted variance across observations. Additionally, the coefficients for renew_cons and petrol_cons are both insignificant at the 10% level which is interesting. One reason for this could be due to the units for both petroleum and renewable energy consumption. The results indicate that a 1 quadrillion BTU increase in renewable energy would decrease GDP per capita by 3,670 U.S dollars. Though insignificant, increasing renewable energy consumption by that much may cause a country's trade deficit to increase due to the importation of necessary intermediate goods, thereby decreasing GDP per capita. A similar issue may arise when increasing petroleum consumption as well. On the other hand, it could be that other factors like goods exportation and growth in other sectors of the economy have a bigger impact on GDP per capita. Though both coefficients are statistically insignificant, discussing the economic implications could open the door for further exploration.
Model 3 is identical to Model 2 but observes how changes in consumption growth affect GDP per capita growth while also allowing coefficients to be interpreted differently (Figure 5).
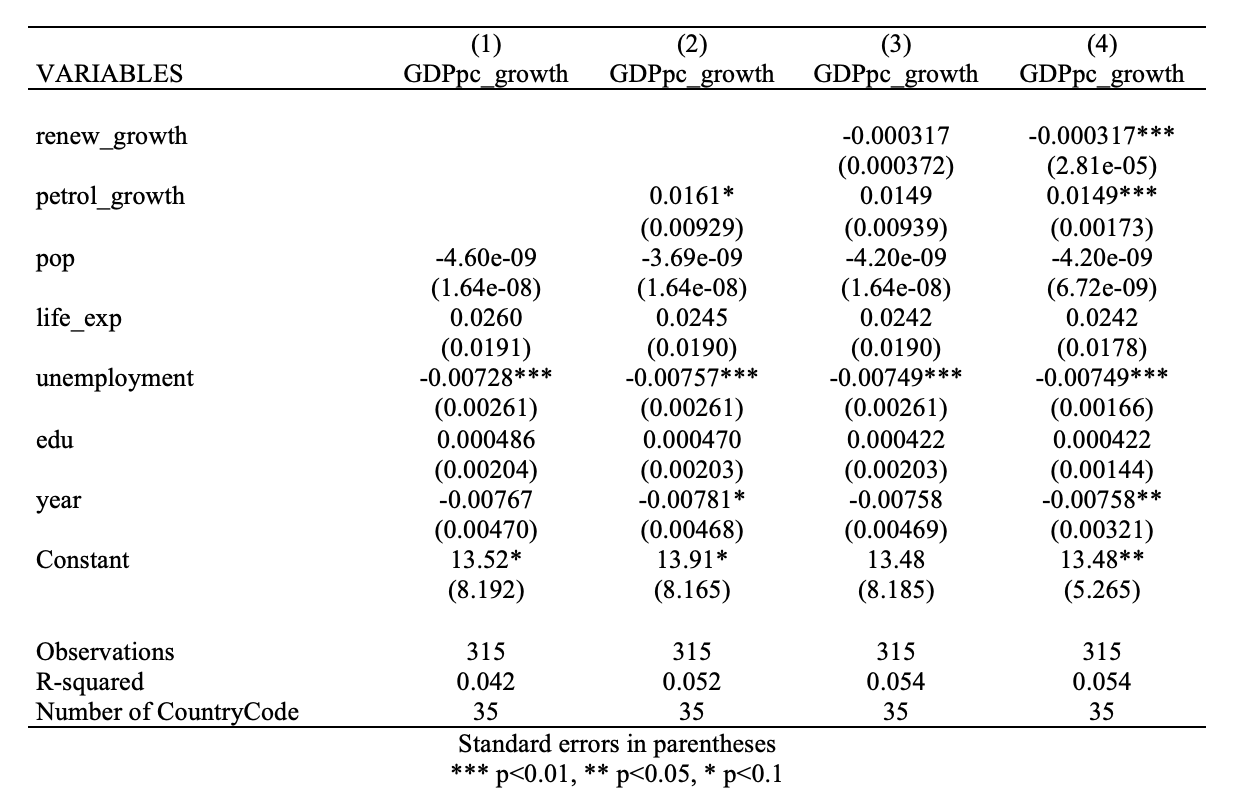
The regression from Model 3 yields quite similar findings to Model 2, but now the coefficients for both renew_growth and petrol_growth are statistically significant at the 1% level in the fourth iteration with robust standard errors. This result is also interesting considering the low R-squared value across all four iterations of the model. Even so, how does one explain this change in significance from Model 2 to Model 3? Observing energy consumption habits is useful, but a growth model can help uncover trends in consumption habits that emerge over time. In this case, it’s likely these trends rather than the consumption levels themselves are more impactful on GDP per capita over time. Looking now at the coefficient values themselves, the regression estimates that growth in petroleum consumption will increase GDP per capita by 1.49%. This aligns with the economic theory mentioned earlier. Petroleum is a necessary factor of production, and as economic output increases, petroleum consumption will likely have to increase accordingly as well. On the other hand, growth in renewable energy consumption is estimated to negatively impact GDP per capita growth. Even though the magnitude is very small, estimated to be only -.0317%, this result is interesting, nonetheless. One reason for this estimated negative impact on GDP per capita could be due to costs associated with renewable energy production. For countries with relatively low renewable energy consumption levels, there likely is not a robust market for parts necessary to produce renewable energy. Importing the necessary parts could be costly and decrease GDP per capita as a result. Additionally, there may be fewer economic or policy incentives surrounding renewable energy production and increasing renewable energy consumption may create additional costs and burdens for suppliers.
Conclusion
The results from all three models provide interesting results. Model 1 estimates there to be a significant positive effect of renewable energy consumption on life expectancy. Although, noting the magnitude of the coefficient and existing energy consumption for a given country, a change in consumption by 1 quadrillion BTUs may mean a complete overhaul in the structure of a country’s power grid. This may result in a near-complete transition to renewables and with little to no fossil fuel consumption, existing literature suggests that this would positively impact life expectancy. On the other hand, Model 2 yields minimal results regarding the estimated effect of renewable energy consumption on GDP per capita. This could be attributed to other economic factors being more influential on GDP per capita than renewable energy consumption. Model 3 observes how growth in renewable consumption impacts GDP per capita growth, and interpreting the estimated results opens an interesting discussion. Growth in renewable energy consumption may require countries to outsource necessary production inputs which negatively impacts GDP per capita. Additionally, fewer economic incentives could make renewable energy production expensive for firms. However, the magnitude of the coefficient was small, estimating growth in renewable energy consumption would have a .037% decrease in GDP per capita. Another interesting result was in the fourth iteration of Models 1 and 2 which uses robust standard errors and the coefficient values for both renew_cons and petrol_cons are both significant at the 1% level. Robust standard errors allow for systematic or misspecification issues to be addressed but adding controls that account for policy incentives or factors in carbon credit trading activities could have been useful to include. Similarly, though all three models used a fixed effect approach, discussing the distribution of the positive externalities of renewable energy consumption across population demographics would be worthwhile as well. The omission of these aspects was mainly due to the scope and time limitations of this paper. Even so, the findings in this paper offer good starting points for continued research and discussion.
References
"Environmental Health Risks and Housing Values: Evidence from 1,600 Toxic Plant Openings and Closings."Currie, Janet, Lucas Davis, Michael Greenstone, and Reed Walker. 2015.
"Growth, Pollution, and Life Expectancy: China from 1991-2012." Ebenstein, Avraham, Maoyong Fan, Michael Greenstone, Guojun He, Peng Yin, and Maigeng Zhou. 2015.
"The Paris Agreement." UNFCCC, United Nations Framework Convention on Climate Change (UNFCCC). https://unfccc.int/process-and-meetings/the-paris-agreement. Accessed 3 Dec. 2024.
“Substitute or complement? Assessing renewable and nonrenewable energy in OECD countries.” Kumar, S., Fujii, H., & Managi, S. (2015). Applied Economics (From SSCI), 47(14), 1438–1459. https://doi.org/10.1080/00036846.2014.997922
“Location is a major barrier for transferring US fossil fuel employment to green jobs.” Lim, J., Aklin, M. & Frank, M.R. Nat Commun (From SSCI) 14, 5711 (2023). https://doi.org/10.1038/s41467-023-41133-9


